Introduction
In 2007, the students on course MARV4/2 get familiar
with photogrammetric single-tree remote sensing (STRS). The objective
of the course is to make an inventory of the timber resources of
a 56-hectare forest holding using both airborne and field observations..
The area is covered by large-scale digitized and digital
aerial images and two sets of LiDAR observations. A sparse LiDAR data
set has been processed into an accurate digital elevation model (DTM).
A method of STRS is applied in which individual trees are
measured for the following STRS-variables:
- Tree top position, XYZ
- Height, image-based
- Height, LiDAR-based
- Crown width, image-based observation
- Crown width, LiDAR-based
- Species, visual
- Species, image-based spectral classification
A systematic layout of fixed-area circular
plots with a radius of 11.28 m (0.04 ha) has been established in
the area. A sample of these, 59 plots, was selected for measurements
in the field. In the field, the photo-measured trees are identified
and measured, and the missing trees - omission errors of STRS - are completed.
The data is analysed to answer the following
top-level, general questions
- What is the accuracy of the tree-level
STRS variables?
- Can the STRS estimates be calibrated to
improve their accuracy?
- What are the timber resources in the 56-hecrate
area?
The students' role - together with the
tutors - is to analyze the questions further in order to perceive
the detailed questions hidden in the general questions.
|
Contents
1 Learning
objectives
2 Study area
3 On
coordinate systems
4 Airborne data sets
LiDAR
Imagery
[Finnish: Information
on aerial photographs and LiDAR in Hyytiälä]
5 LiDAR-based DTM
6 Single-tree remote sensing methods applied on the
course
1 Manual photogrammetric
treetop positioning and image-based measurement of crown width
2 Visual tree species
intrepretation
3 Semi-automatic image-based
treetop positioning using multi-scale template matching
4
Measurement of crown width by template matching
5 Measurement of crown
width by adjustment of a parametric crown model with the LiDAR point
cloud
6 Use of allometric
models for predicting the dbh and the stem dimensions
7 Field work in Hyytiälä
1 Objective of field
work
2 Mapping
trees in the field using the photo-trees and a method that combines
field triangulation and trilateration
3 Plot measurements
8 Office work, Viikki-Hyytiälä-Viikki
1 STRS-Labs April 18-19.
2 Field plots, forms, work instructions by groups
3 Preparing field forms In Helsinki, April
4
Preparing the maps and labels Helsinki, April
5 Storing data for scientific analysis Hyytiälä,
May
6 Instructions for data analysis and reporting,
Viikki May, 14-18
Index
of plot files (59) all.csv
contains "everything"
Index
of field forms (59)
Index
of sightings (59)
Reports: Honkasalo & Ilvesniemi 23.5., Salo &
Bruun 4.6., Haapaniemi #.#., Mustonen & Suomi 24.5.,
Schäfer & Virtanen 30.5., Kuutti & Linkosalmi #.#.
9
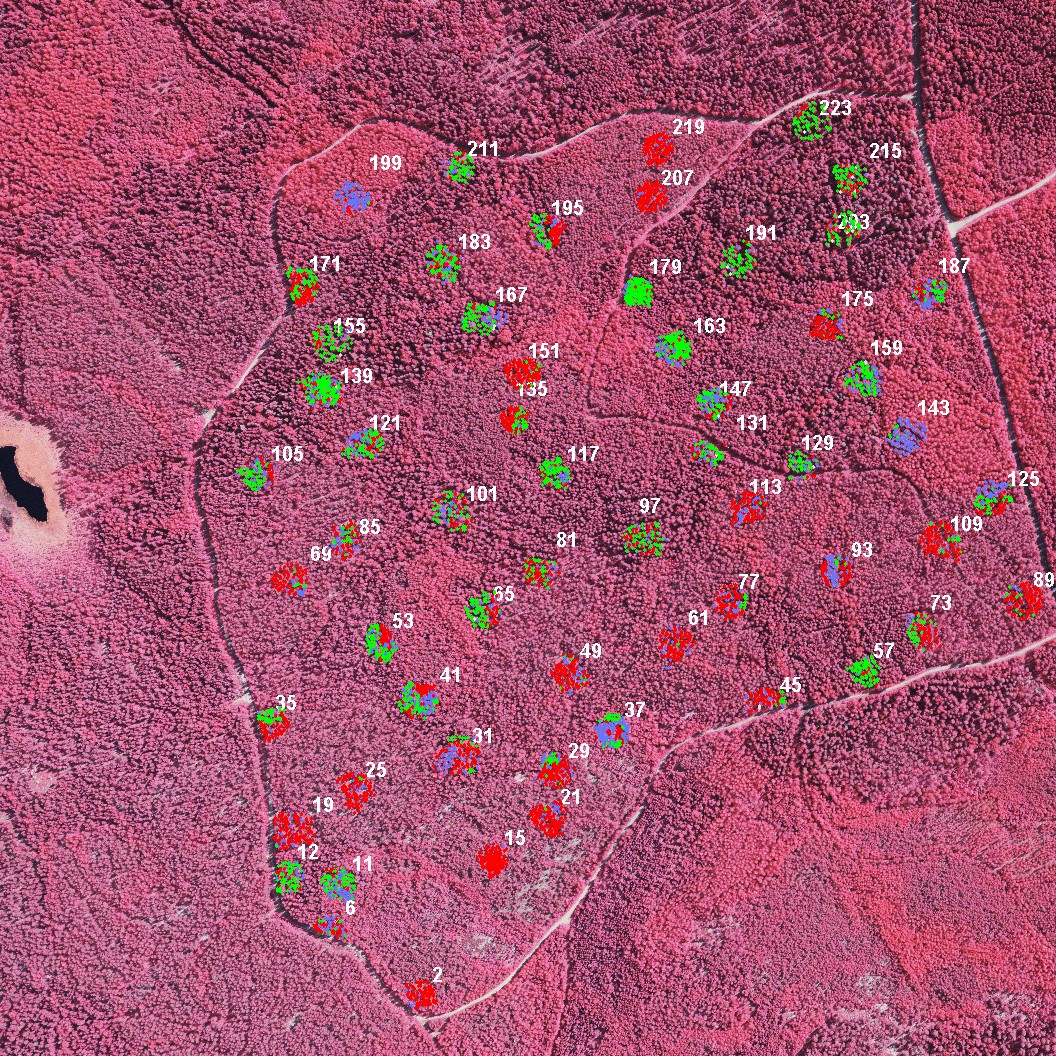
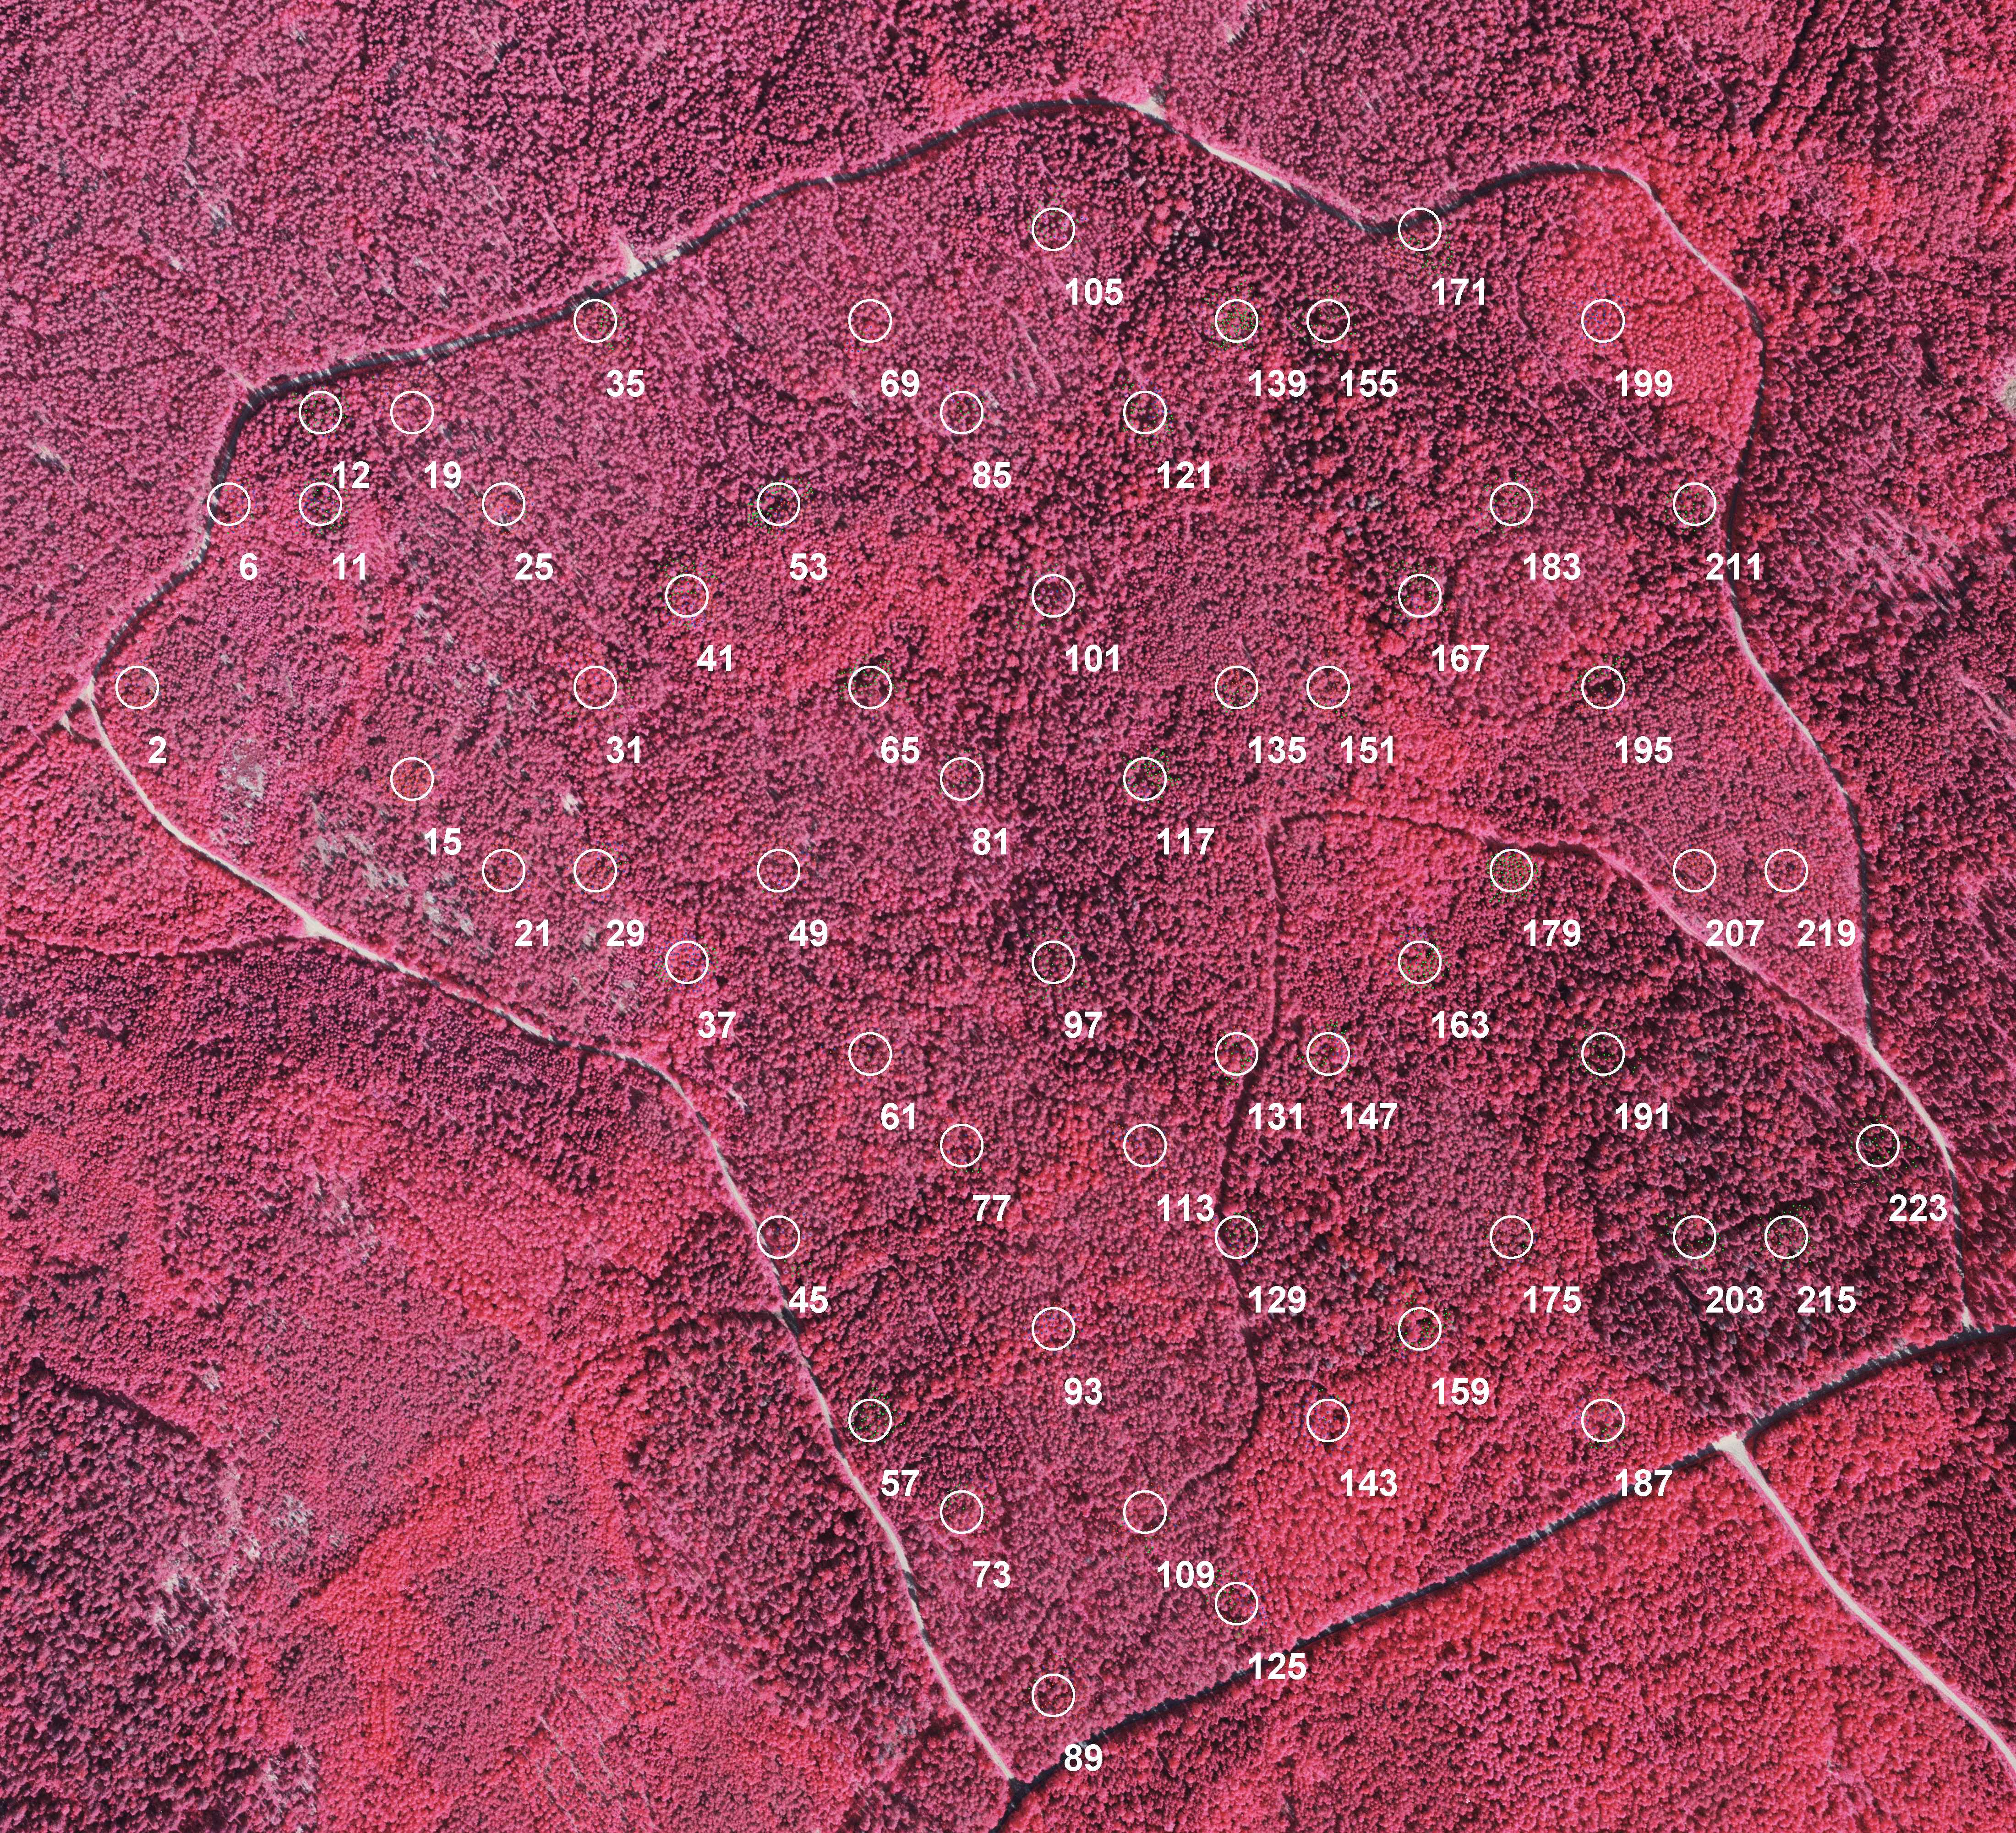
Data sets - bulk work done in advance
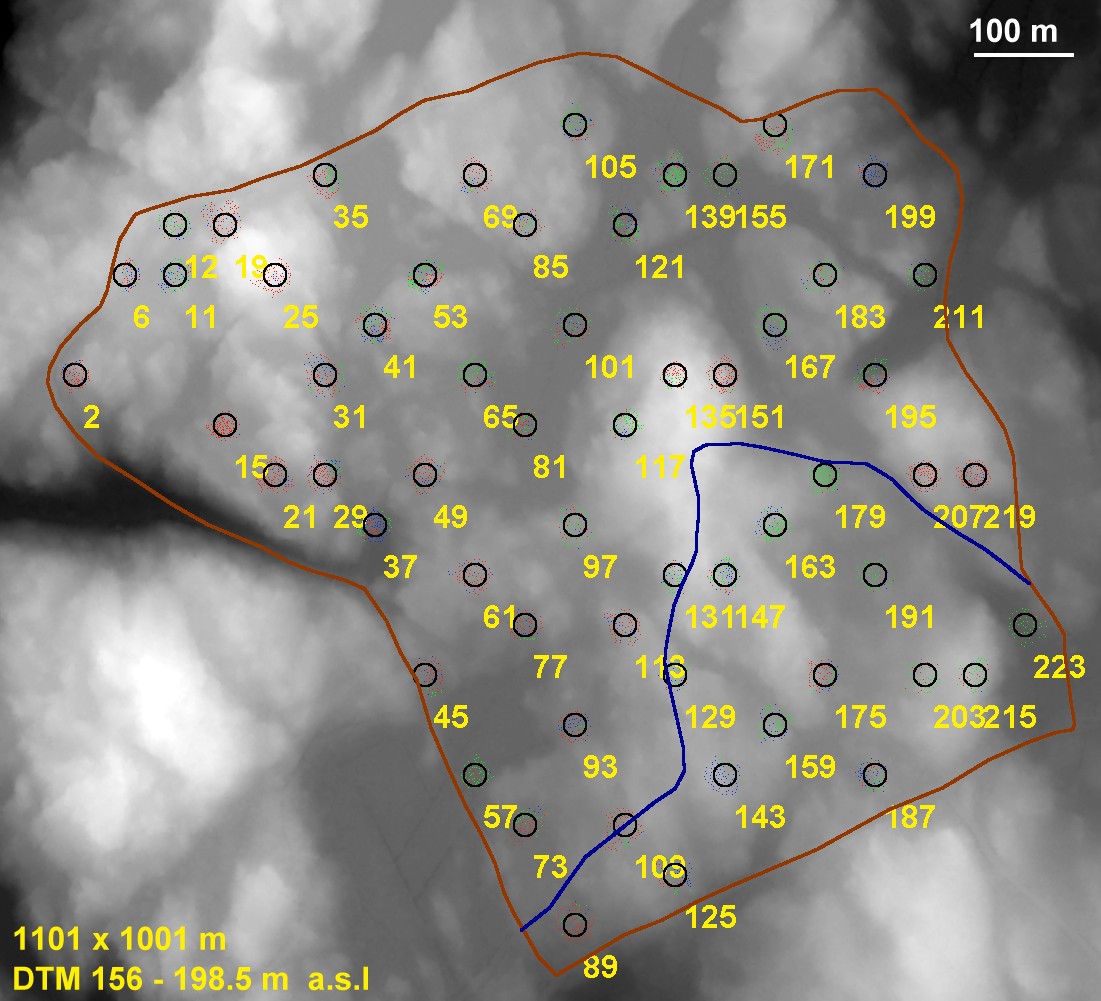
- A systematic 50 x 50-m grid was established in the area.
- 224 plots were inside an area-polyline. Every 4th plot was selected
for photogrammetric STRS measurements. A total of 59 plots and 5294
trees were measured and they are seen here in an aerial view (orthoview) The every-4th-rule was violated
(accidently) a few times, so each plot represents an area of 0.9635
ha. Nor is the spatial pattern of the plots optimal. The measurements
include trees from a buffer surrounding each plot. The measurements
contain plenty of redundancy as only 41.6 % or 2206 of the 5294 measured
trees were inside the 59 0.04-ha circular plots
- IDs of the 59 measured plots (ascii-file)
- Photogrammetric observations of the 5294
trees in an ascii file with variables:
PlotCode, TreeNumber, Species, Xtop, Ytop, Ztop, Z_DTM, Foto_h,
Lidar_h, Dcrm_Foto, Dcrm_Lidar, Dcrm_RMSE, a1, a2, a3, DistanceFromCenter,
AzimuthFromCenter, InOut
- " " " in 59 files -
zip-file
- 224 files / LiDAR-based estimates on V, N, G, H
and D zip-file
- " " " in one
ascii-file
- Tree maps, 59 pdf-files,
zip-file
- Tree labels, 59 pdf-files, zip-file
-
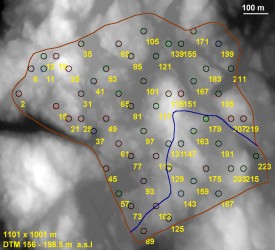
DTM-with photo-trees, circles, roads and plot numbers. 1-m resolution.
1101 x 1001 m. Origin XY = 2515200, 6860350 (pixel center).
-
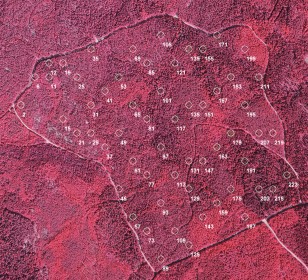
Ortho-image with photo trees, circles and plot numbers. Click here for a compressed version with
4401 x 4001 pixels (0.25 cm, 2.4 MB), 1100.25 x 1000.25 m. Origin
XY = 2515200, 6860350 (pixel center). Uncompressed file size 51.5 MBytes.
- GPS observations for CentrePoles; Zip, All (54) but 163, 191, 195, 207, 219.

10 Programs
|
