In photogrammetric STRS inventory our measurements and model estimates are prone to both systematic and random errors. It is possible to reduce some of this inaccuracy by calibration. For that we need measurements in the field that are one-to-one linkable with the STRS-trees. Also, the use of STRS leads to an unavoidable underestimation of the tree population, since the small trees remain unseen. We wish to know what this population is, and if the omission error-rate (process) is affected by the properties of the upper canopy. STRS can go wrong in that it produces false trees - commission errors. These are even more disturbing than the missed trees. We can detect the ghost trees only by visiting the field.
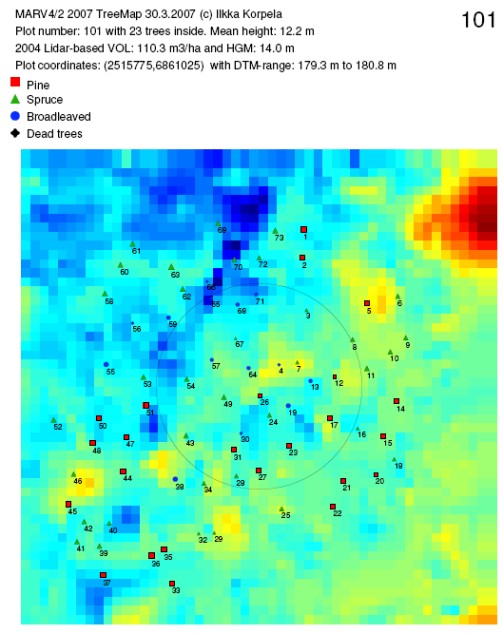
Fig. 1. An example of STRS measurements on a map. The trees have symbols that reflect the species and the photogrammetric height. Treetop positions are reasonable estimates for the stem positions - at least for the non-slant, vertical stems that have a peaked crown. The map is not complete: Some trees may have been missed and some trees are clearly in a wrong position. The HSV-colored bitmap represents the DTM in 1-m cells.
Fig 2. The tree map (STRS measurements) can
be processed into tree labels, which have the following information: serial
number, plot ID, distance from the plot center, azimuth observed by a compass
from the plot center, tree ID, map of neighbors with the ID and excepted
azimuth, species and height.
In the field, inside a 11.28-m circular plot
- The photo-plot (set of photo-trees) and its trees are located
using a GPS and a tree map (Fig 1). Plot center is found.
- The photo-trees are identified and labeled (Fig 2). Ghost trees
are reported and rejected and given a new ID. If the tree map is reliable,
the identification is most conveniently done by triangulation using intertree
azimuths and a precision compass
- Missed trees belonging to the plot are identified, given an ID
and labeled. There is a fixed lower limit in dbh for the missed trees to
be included and it is 50 mm.
- All trees are identified for the species and measured for dbh.
- A sub-set of trees is measured for height, height of the lowest
living branch and the maximal crown width
- The originally missed trees are positioned using intertree azimuth
and intertree distance observations between the photo-trees and the trees
that need XY-positioning.
Fig. 3. Once the photo-trees (PA) have been identified in the field, it is possible to use them for the positioning of other targets (P0). Interpoint (intretree) azimuths and/or distances are needed for that. In the process, which is combined triangulation and trilateration - standard method in geodesy - the unknown point P0 is located. An error estimate is obtained also, if redundant (extra, 3 or more) observations were done. Intertree azimuths are observed with a precision compass ('bussoli') and intertree distances using a laser rangefinder or a metal tape in dense vegetation.