| Semi-automatic image-based treetop
positioning using multi-scale template matching
Template matching (TM) is a straightforward and simple object detection
method in image analysis. It is based on a model of the object that we search
- e.g. model images of letters (a,b,c..) in text recognition. It is possible
to use TM for the detection of treetops in aerial images. However, since
the appearance of tree crowns changes continuously over the image- as a result
of the central projection - we need model images (templates) that apply
to this variation. Such templates have been generated using methods of computer
graphics, or, it is possible to use the real images and copy templates from
them.
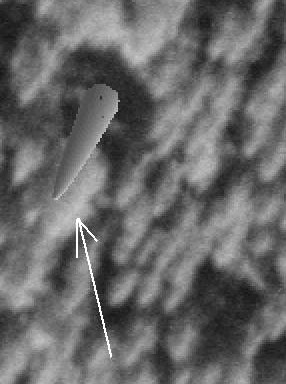
Fig. 1. An example of a synthetic crown image
that was generated using a image-rendering method called the Z-buffering.
It is superimposed in a BW aerial image. The crown model here was simple:
an opaque paraboloid. The image intensity was determined by calculating
the angle between the incoming sun rays (diffuse light from the hemisphere
was omitted) and the surface normal of the crown envelope. Z-buffering is
a method for determining, which point in the object was visible to the camera.
There is no shadow cast by the object .
Template is a small image t(i,j) of size M × N pixels, and the treetop point feature has a certain location (column, row) inside the template. 
Fig. 2. Enlarged, real (tempale) copy of a
crown in a near-nadir view.
The image f(x,y) is operated with the
template t(i,j) at certain locations of the image and we get some
form of output g(x,y). The form of g depends of the the operation
that is performed. One common, computer intensive operation is normalized
cross-correlation, which has an output g that is a correlation function
(image) scaled between -1 and 1. If g(x,y) = 1, there is a
perfect match between f and t.
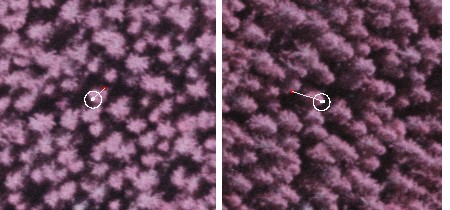
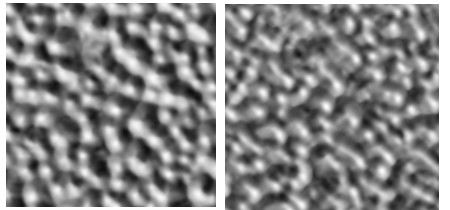
Fig. 3. The upper rows shows two views f,
and the capture (copy) of 2 elliptic templates t. Cross-correlation
f×t has been computed and the resulting 2
correlation functions g are presented below. g are coded so
that black marks g = -1 and white denotes g = +1.Note the bright
spots at locations (x,y), where there is a crown in the aerial views.
Now, local maxima of g(x,y) (see Fig 3) are image positions (x,y) where there are crowns that are similar to the appearance of the tree that "produced" the templates t. Actually, the local maxima correspond to treetop positions. In order to know where the treetops are in 3D, please consider Fig 4. 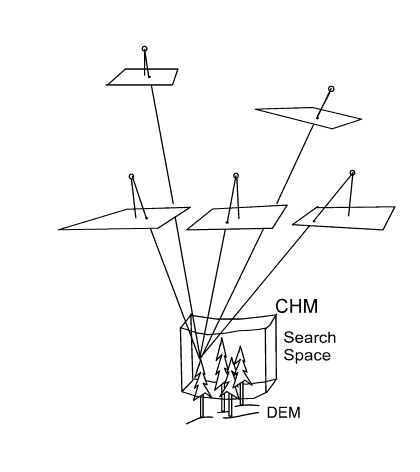
Fig 4. In the object space (real 3D world,
the canopy), there are 3D points that are our points of interest, treetops.
If we know the terrain elevation, i.e. have access to an accurate DTM, we
know that treetops cannot reside below elevation Z of terrain in point (X,Y).
We also know from experience in manual treetop positioning that trees, which
have a relative height of below 0.5 are most likely not seen in the aerial
images f or their correlation image versions g. Now,
what we can do is to guess the canopy height and thereby form a 3D search
space that starts from the 50% relative height and reaches to the upper canopy.
This search space can then be filled by a 3D point mesh, i.e. a dense grid
of XYZ points. We can then compute for each such point their position in
the images g and calculate a sum of correlations. If that XYZ-point
is close to a true treetop position, it will likely receive a high sum of
correlation. XYZ-points have now an associated correlation value. Consider
the correlation as "temperature". The task is now to find the hot spots in
this volumetric data (Fig 5).
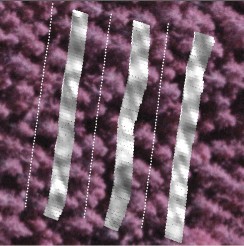
Fig 5. The 3D correlation is superimposed
here in 3 slices. The "hot spots" are seen in white.
|
Back to index,
Next
Manual/Semi-automatic Multi-Scale template matching
for tree top positioning
3D treetop positioning using TM in the way that was described works fine if the search space is corretly delianeted to the upper canopy and the trees do not exhibit a lot of variation in crown size, shape and color (species) as in Fig. 6. However, in mixed stands and in cases where the appearance of the crowns vary considerably the method fails in providing accurate treetop positions with a high success rate (Fig. 7). 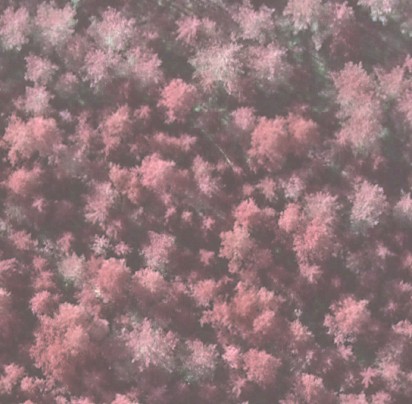
Fig 7. An example of a complex case, which
actually is not so rare in practice: Large crowns of pines, birch crowns of
varying size and small crowns of spruce. These types of forests are most likely
difficult to measure reliably both in the field and from the air.
To make TM robust to the size variation of crowns, we can assume the following: The crowns of small trees in the aerial images are downsized versions of the crowns of the big trees, i.e. the small and big crowns have more or less the same 3D shape and color. Hence, we can make series of scales of the template t (Fig. 8). Fig. 8. Seven scales of a template t.
Down/Upsizing was done using bilinear resampling.
We can use the real images and manually measure
a model tree as depicted in Fig. 3 and copy the templates t for each
of the M images that are available. Then we scale the M templates in N scales
and store them.
After that the search for 3D treetops of trees that resemble the model tree, but vary in size, can be done in the following way (see Fig. 9): 1. Select an image where treetops are easily detected. 2. Measure an image point, which has a tree top 3. This defines a reference image-ray down from the camera 4. Sample this 3D ray over a range in Z, where we assume treetops to be, the Z-range-of-interest 5. Back-project these XYZ-points to the images and compute cross-correlation for all N scales and sum/average the correlation from each image for each scale. 6. Each sampled point has now N values of correlation, where N is the number of scales (Fig 10.). The treetop 3D position is the locus with maximal cross-correlation. 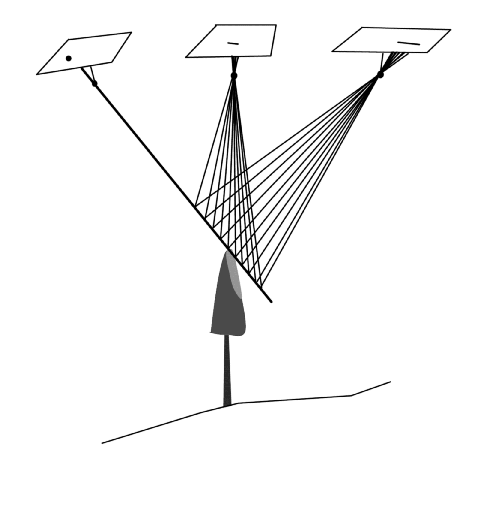
Fig. 9. Image on the left is the reference
image. The operator finds (points) a treetop in that image, which establishes
an image ray. The treetop must be located somewhere along this ray. The
ray is sampled for points XYZ over a range in Z. At each locus, compute
template matching for all scales in all images and sum the correlation for
that point/scale combination.
. 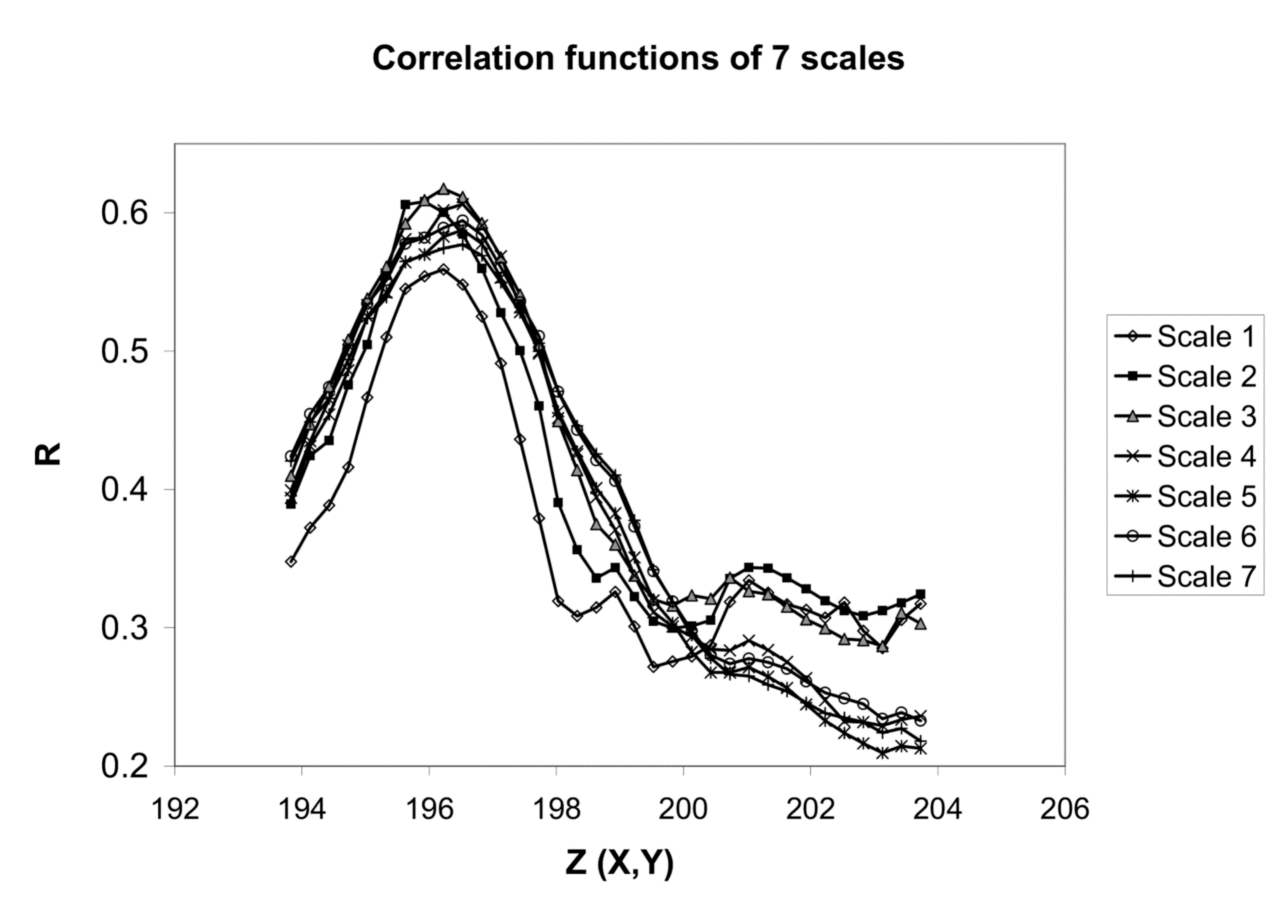
Fig. 10. The reference ray was sampled here between Z ~ 194 m and Z ~ 204 m and TM was tried in seven scales. The point with maximal correlation is the solution, treetop XYZ-solution. Two views are needed at least, but the solution of the correspondence problem is more reliable if several views are available (Fig. 11). 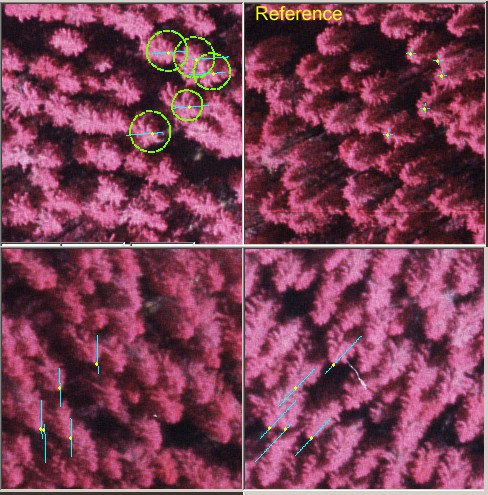
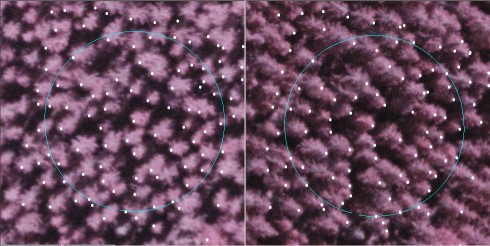
Fig. 11. A spruce stand seen in 4 views. The
aerial view marked as "Reference" was used by the operator to point treetop
image positions, + -marks in the images. The yellow dots are the solutions
of 5 treetop positions. The reference image rays are seen as blue line segments
for the "range-of-interest" in Z, which here was ± 6 m with respect
to the Z of the previously measured treetop. The green circles are
estimates of crown width, explained in the next section.
Distinct notes
|