Converting STRS observations of species, height and Dcrm into dbh
Kalliovirta and Tokola (2005) have published functions for predicting dbh and tree age using height, crown width and existing stand database information in Finland using NFI data. The functions are divided for the different vegetation zones.
In addition to the resuts: models and their parameters - the main findings in their article are:
- The relationship between the variables is almost linear, however
the geographic division of the data and models reflects large-scale differences
- Sp and Dcrm result in dbh-estimation inaccuracy that is in the order of 13-15 % (in model RMSE)
- Having all three variables - Sp, Dcrm and height - improve the
estimation accuracy of dbh to 7-12 % (in model RMSE)

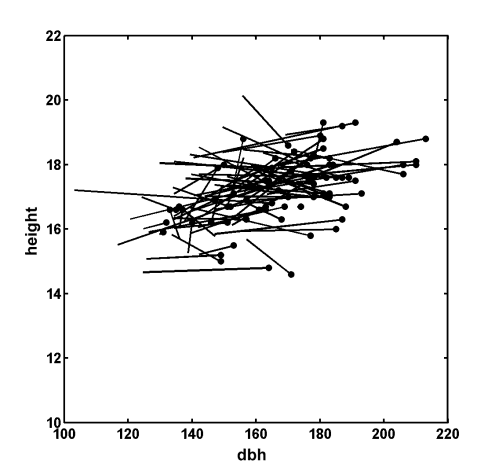
Fig. 1. An example of a dbh x height distribution in a birch stand. The dots represent the true, field measured values and the vectors point to the STRS estimates. Note that dbh was underestimated in most cases because Dcrm measurements made in images were underestimates. The error vectors are mostly horizontal, which reflects the height measurement accuracy.
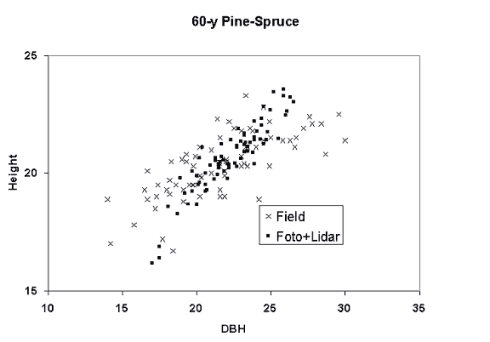
Allometric models are regression models and their use results in an averaging effect (Fig. 2).

Estimation of stem dimensions using taper curves
The Sp, dbh and h estimates can be used (we will use) for predicting a taper curve using for example Laasasenaho's (1983) polynomial functions, which are well known in Finland. They are allometric models also, and they have been estimated using a large data set of stem measurements in the 1960s and 1970s. If they are used for computing the stem volume, the model error is approximately 9% when the basic species-spesific polynom has been corrected with the dbh and height observations. This model inaccuracy can be divided into error variance between trees and between stands (Korhonen ####), and the errors of the model estimates can be considerably correlated among trees in one stand (i.e. model estimates are locally biased). This could reflect the stand-history and its effect on the allometry of trees in that stand.

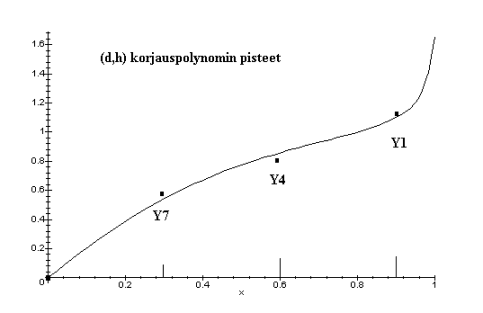
Fig 3. Basic taper curve (tapering relative to diameter at the 20% height) for pine, and points Y1, Y4 and Y7, which are used for calculating additive corrections (a third degree polynom with zero constant) to three of the eight coefficents of the taper curve, when dbh and h have been observed.

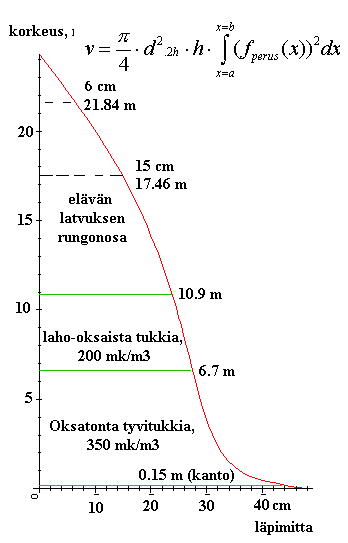
Fig. 4. The taper curve can be used for computing
volumes of logs, when the dbh (d) and height (h) are known.