Stand Management Assistant (SMA)

2. Program Structure

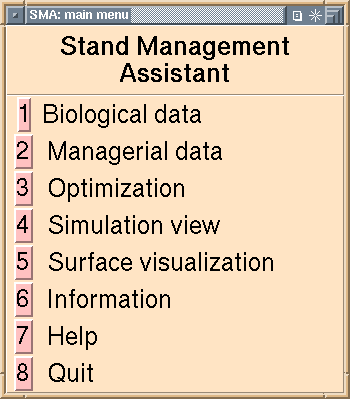
The program consists of three basic functions: simulation, optimization and visualization. The mouse driven user interface in divided into 8 parts:
  1. Biological data
  2. Managerial data
  3. Optimization
  4. Simulation view
  5. Surface visualization
  6. Information
  7. Help
  8. Quit

The program elements show on the initial window of SMA.

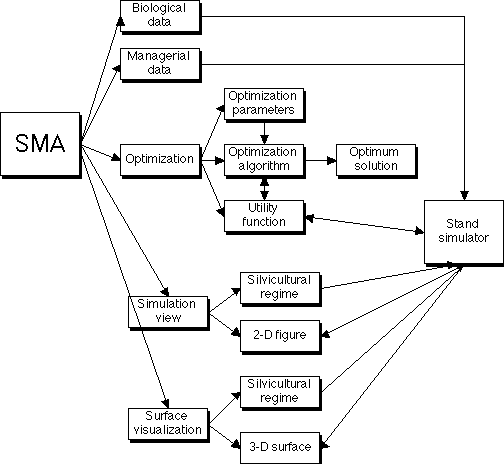
The relation of the program elements are shown in the figure below. The stand simulator is called by several routines to provide responses to silvicultural regimes


The input data for the system are specified in two windows (biological data and economic data).
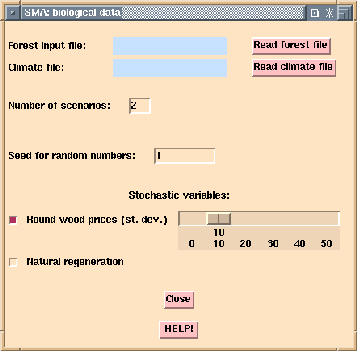
Biological data

The window lets the user identify input files and parameters related to stochasticity in the model. Note that the borders of the window will vary according to the window manager used.


Managerial data

This is the window for data related to treatments and economics.


Optimization data

This module handles optimization parameters, the initial solution, the utility function, and control of the optimization process.


Simulation view

Optimum or user defined silvicultural regimes can be graphed using this module.


Surface visualization

The response surface around the optimum or a user defined point can be viewed as 3-dimensional figures. This provides a visual sensitivity analysis.


Information

This points to information about the version of SMA in use.

Help

The help buttons bring up help pages for different program modules.

Go next to: