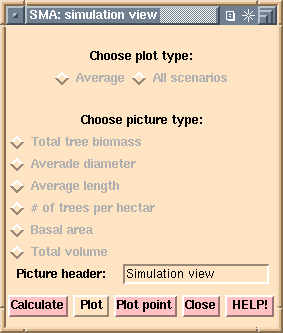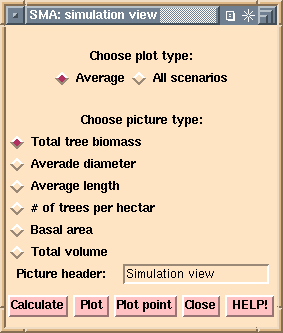


Most of buttons are disabled in the left hand size window. They become enabled after a simulation is calculated by clicking the Calculate button. Before that the silvicultural regime may be changed by clicking Plot point (see point input about that).
Two plot types are available: Average refers to values computed by averaging scenario-wise developments, All scenarios produces a line for each scenario (or the first 10 scenarios if there are more than that of them).
The list of picture types corresponds to the information available by the stand simulator used. A header for the picture can be typed in to the accompanying box.
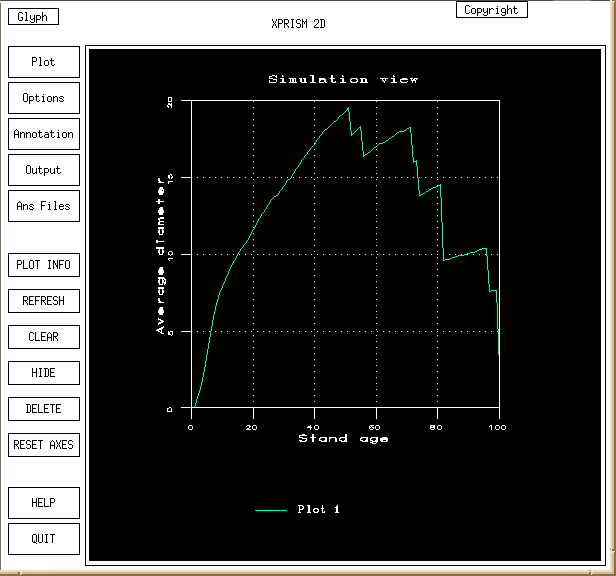
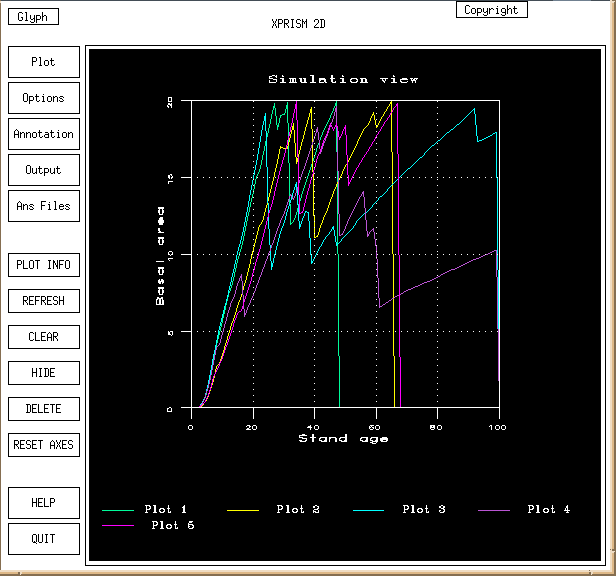
The Plot button invokes the program xprism2 of the Khoros visualization system with input data produced by the stand simulator. Two sample graphs are shown below, one for the average values and another for all scenarios.


Many of the properties of the graph can be adjusted via Khoros control functions. The graphs may be saved to files or plotted on PostScript color or monochrome printers. There is also an extensive help facility associated.