Erikoisharjoitus III Puiden latvapisteiden
puoliautomaattinen 3D paikantaminen ilmakuvilta lidar-pintamalleja hyödyntäen,
Opettajan esimerkki
Special assignment III Semi-automatic 3D positioning
of tree tops from aerial images using lidar surface models, teacher's example
Ryhmä tutkii perusharjoituksessa läpi käydyn latvojen paikantamismenetelmän
potentiaalia osoitetuissa kohteissa. Ryhmä valitsee vähintään
yhden viidestä metsikkökoealasta, joskin menetelmää
saa testata millä tahansa 26 koealasta, joille referenssiaineistoa
löytyy D:\MINV12\PUUDATA -hakemistosta. The group
assesses the potential of the method that was presented in the basic exercises.
Choose one sample plot among the five that have been
prepared for. However, you may select any of the 26 plots for which the reference
data is available.
Tutkimukselliset kysymykset ovat The scientific questions
are
- Eri mittakaavan kuvilla (mittakaavakombinaatiot) saavutettu tarkkuustaso
eri tarkkuusmittarein: RMSE(Z), RMSE(XY), Match-Rate-%,...
Accuracy of 3D tree top positioning with images
of varying scale or scale combinations using varying measures of accuracy
- Kuvamäärän vaikutus
Effect of the number of images
- Menetelmän herkkyys parametreille: mallipuu, maskin koko ja
muoto, hakuavaruus sekä klusterointiparametrit
The sensitivity of the method to the different
parameters
- Käyttäjäkokemukset
Report your overall experiences on the usability.
Valitsin kohteeksi muistokuusikon, joka on selkeä, miltei yhden
puulajin istuskuusikko, ja jota on käsitelty alaharvennuksin I chose Muistokuusikko, which is a "simple case", mature
planted spruce stand which has undergone a thin-from-below thinning regime.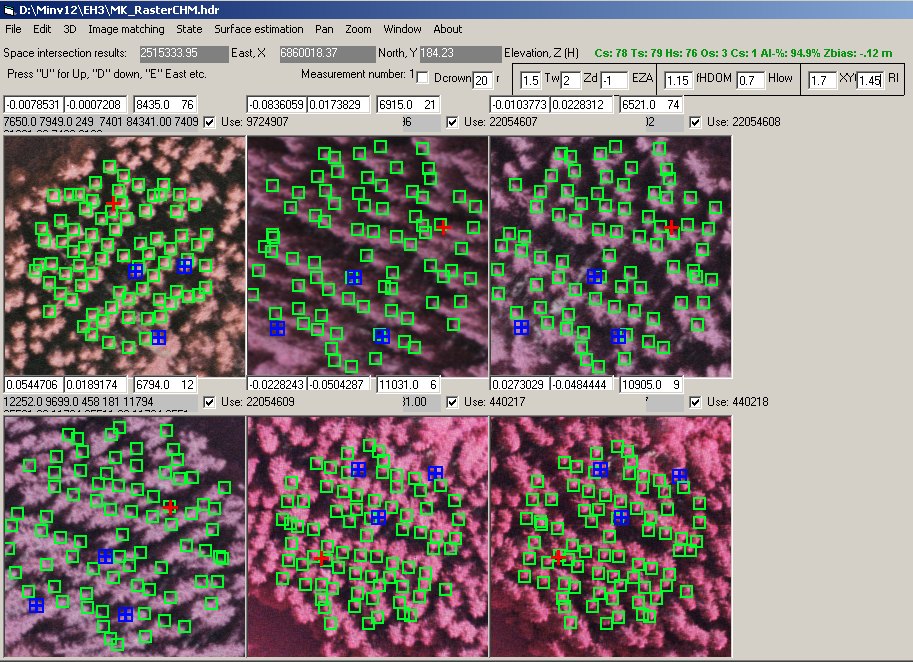
Ensiimmäiseksi kokeilin, mihin johtaa "ilmakuvien sekakäyttö";
yhteensovituksessa on kuvat 1:16000/1997, 3 x 1:12000/2002 ja 2 x 14000/2004.
Koska 1997 kuva on nadiritapaus, siksi ei se vaikuta käytännössä
lainkaan saatujen pisteiden Z:aan. Myöskin 2004 kuvat, jotka on otettu
21 cm poltovälin kameralla, antavat vähän kontribuutiota
Z:aan, mutta vakauttavat estimointia. 79 puusta löytyy 76 (96.2 %)
yhdellä komissiovirheellä eli AI-% saa arvon 94.9 %. 2002 maastossa
mitatuihin latvan paikkoihin nähden tulos on miltei harhaton Z:n suhteen
(-0.12 m). RMSE(dZ) oli 0.64 m ja RMSE(dXY) 0.56 m. First I tested what happens if multi-scale, multi-temporal
images are used simoultaneously. The matching involved a nadir image (1:16000,
15/23 cm) from 1997, three 1:12000 images (15/23 cm) from a strip with 70%
overlap taken in 2002 and an image pair (21/23 cm) with 80% overlap. Since
the 1997 image is a nadir view it gives contribution largely to XY-estimation.
Similarly the geometry of 2004 images gives less contribution to the estimation
of the Z. With a photo-plot that had a radius of 20 m I managed to find 76
tree tops out of 79 with a single false tree giving an AI-% of 94.9. The
reference field data is from august 2002 and the image-positioned tree tops
were on average 12 cm above the reference data. The XY and Z errors had RMSEs
of 64 cm and 56 cm, respectively.
Kokeilujen tulokset menevät KUVAMITT-ohjelmassa tiedostoon (Open
"c:\data\ma4res.txt" For Append As 1 -aliohjelmassa PrintResults),
sinne ei kuitenkaan tallennu kaikkia tarpeellisia muuttujia. Katso alla
olevia muutoksia. KUVAMITT writes a log-file, where
the results are written in append mode. I altered the procedures.
Module1.BAS declarations osassa muutin
changes in red in the "declarations" section of module1.bas
Type OutputVector
PlotCode As String * 4
Date As String * 10
Time As String * 8
NImagesInMatch As Integer
ImInfo(0 To MAXIMA - 1) As ImageInfoForOutput
BkProjTime As Double
ModelTreeNum As Integer
ModelTreeX As Double
ModelTreeY As Double
ModelTreeZ As Double
Rlimit As Double
XYthin As Double
XYMatchDist As Double
ZMatchDist As Double
TWidth As Double
EllZasym As Double
Zdiff As Double
ZDepth As Double
Zasym As Double
Meshdist As Double
Meanheight As Double
Plotradius As Double
PlotCenterX As Double
PlotCenterY As Double
PlotCenterZ As Double
DigString As String * 8
NtreesInside As Integer
NClusInside As Integer
Nmatched As Integer
Nomission As Integer
NCommission As Integer
MatchP As Double
Mrate As Double ' LISAYS, AI-%
tunnus
ZbiasMatched As Double
ZbiasAll As Double
Xbiasmatched As Double
Ybiasmatched As Double
End Type
Public OV As OutputVector
Aliohjelmassa CheckAccuracy muutin changes in routine CheckAccuracy()
'OV.NtreesInside = N_tree_inside_border ' kommentoitu
pois
'OV.NClusInside = N_cand_inside_border ' kommentoitu pois
OV.NtreesInside = N_tree_inside ' lisätty
OV.NClusInside = N_cand_inside ' lisätty
OV.Nmatched = CountMatches
OV.Nomission = Countomissions
OV.NCommission = CountCommissions
OV.MatchP = (CountMatches / N_tree_inside) * 100#
OV.Mrate = ((N_tree_inside - CountCommissions - Countomissions)
/ N_tree_inside) * 100 ' lisätty AI-% laskukaava
OV.ZbiasMatched = dZave
OV.ZbiasAll = Zbias
OV.Xbiasmatched = dXave
OV.Ybiasmatched = dYave
Aliohjelmassa PrintResults() avataan tulostiedosto, johon tein muutoksia, changes in routine
CheckAccuracy()
Open "c:\data\ma4res.txt" For Append As 1
Dim CO As String
CO = OV.PlotCode & ","
CO = CO & OV.Date & ","
CO = CO & OV.Time & ","
CO = CO & Format$(OV.NImagesInMatch, "0") & ","
' kuvien lkm
CO = CO & Format$(OV.ModelTreeNum, "0000") & ","
' mallipuun n:o
CO = CO & Format$(OV.ModelTreeX, "#.00") & ","
' latvan X
CO = CO & Format$(OV.ModelTreeY, "#.00") & ","
' latvan Y
CO = CO & Format$(OV.ModelTreeZ, "#.00") & ","
' latvan Z
CO = CO & Format$(OV.Rlimit, "#.000") & ","
' Korrelaatio-alaraja Rlimit
CO = CO & Format$(OV.XYthin, "#.00") & ","
' Klusterointi kynnysetäisyys, m
CO = CO & Format$(OV.XYMatchDist, "#.00") & ","
' osumasylinterin säde
CO = CO & Format$(OV.ZMatchDist, "#.00") & ","
' osumasylinterin korkeuden puolikas
CO = CO & Format$(OV.TWidth, "#.00") & ","
' elliptisen maskin leveys (lyhyemmän pääakselin
pituus kohdeavaruudessa, m) ellipsewidth
CO = CO & Format$(OV.EllZasym, "#.00") & ","
' maskin siirto Up/Down -suunnassa, m, ellipseshift
CO = CO & Format$(OV.Zdiff, "#.00") & ","
' maskin "pituus" (pidemmän pääakselin
pituus kohdeavaruudessa, m), elipseheight
CO = CO & Format$(OV.ZDepth, "#.00") & ","
' fHDOM-kerroin
CO = CO & Format$(OV.Zasym, "#.00") & ","
' Hlow-kerroin
CO = CO & Format$(OV.Meshdist, "#.00") & ","
' hilapisteiden etäisyys 0.5 m
CO = CO & Format$(OV.Meanheight, "#.00") & ","
' mallipuun pituus DTM:n avulla
CO = CO & Format$(OV.Plotradius, "#.00") & ","
' ilmakuvakoealan säde
CO = CO & Format$(OV.PlotCenterX, "#.00") & ","
' koealan kp X
CO = CO & Format$(OV.PlotCenterY, "#.00") & ","
' koealan kp Y
CO = CO & Format$(OV.PlotCenterZ, "#.00") & ","
' koealan KP Z
CO = CO & Format$(OV.DigString, "00000000") & ","
' ??
CO = CO & Format$(OV.NtreesInside, "000") & ","
' puita koealan sisällä
'CO = CO & Format$(k, "000") & ","
' uloskommentoitu
CO = CO & Format$(OV.NClusInside, "000") & ","
' kandidaatteja koealan sisällä
CO = CO & Format$(OV.Nmatched, "000") & ","
' löydettyjen puiden lkm
CO = CO & Format$(OV.Nomission, "000") & ","
' löytämättä jääneiden
lkm
CO = CO & Format$(OV.NCommission, "000") & ","
' komissiot
CO = CO & Format$(OV.MatchP, "#.00") & ","
' löytyneet puut / kaikki puut -%
CO = CO & Format$(OV.Mrate, "#.00") & ","
' lisätty rivi ' Acuuracy-index, joka rankaisee komissioista
CO = CO & Format$(OV.ZbiasMatched, "#.00") & ","
' löytyneiden puiden Z-koordinaattien erotusten ka.
CO = CO & Format$(OV.ZbiasAll, "#.00") & ","
' kaikkien puiden aritm. ka. Z:lle ja kandidaattien
Z ka.n ero
CO = CO & Format$(OV.Xbiasmatched, "#.00") & ","
' löytyneiden puiden X-koordinaattien erotusten ka.
CO = CO & Format$(OV.Ybiasmatched, "#.00") & ","
' löytyneiden puiden Y-koordinaattien erotusten
ka.
CO = CO & Format$(RMSEXY, "#.00") & ","
' XY-virhevektoreiden L2-normien RMSE
CO = CO & Format$(RMSEZ, "#.00") & ","
' Z-erotuksista RMSE
CO = CO & Format$(aa, "#.0000") & ","
' Z-erotusten ja puun pituuden yhteisjakaumaan
sovitetun regr.suoran vakio
CO = CO & Format$(bb, "#.0000") & ","
' Z-erotusten ja puun pituuden
yhteisjakaumaan sovitetun regr.suoran kulmakerroin
CO = CO & Format$(seb, "#.0000") & ","
' kulmakertoimen keskivirhe
CO = CO & Format$(r2, "#.0000") & ","
' regression selitysaste
CO = CO & Format$(VolMatch, "#.0000") & ","
' löydettyjen puiden tilavuus litroina
CO = CO & Format$(VolMissed, "#.0000")
' löytämättä jääneiden
puide tilavuus litroina
Print #1, CO
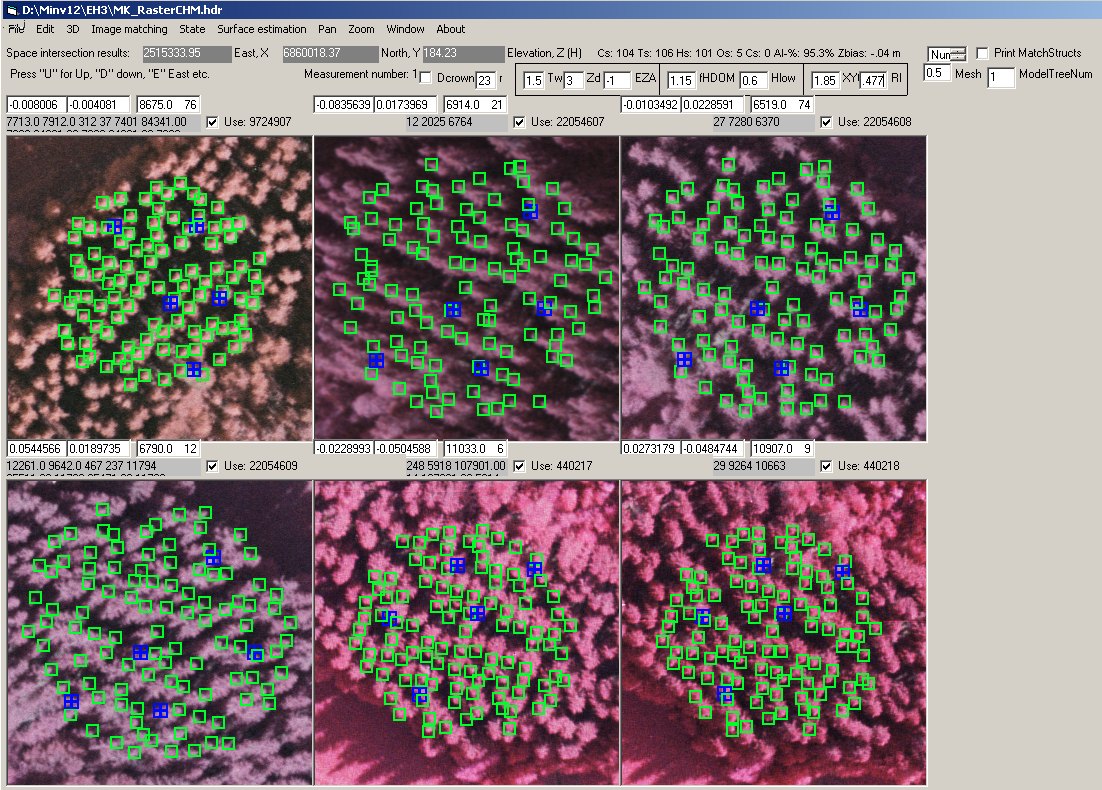
Kuva: Samalla kuvajoukolla ja mallipuulla, hieman suuremmalla kuvamaskilla
ja syvemmällä hakuavaruudella sekä isommalla koealalla saatiin
hyviä tuloksia 31.3.2006 klo 15:27:52. C:\DATA\MA4RES.TXT
tulostietietue oli Using the same multi-temporal,
multi-scale image set, but a little larger tempale and deeper search space
the matching results were slightly improved on March 31, 2006 at 15:27:52.
The record in file c:\data\ma4res.txt became:
T1 ,31.3.2006 ,15:27:52,6,0001,2515333.95,6860018.37,184.23,1.477,1.85,1.30,3.00,1.50,-1.00,3.00,1.15,.60,.50,25.91,
23.00,2515333.95,6860018.37,184.23,52486842,106,104,101,005,000,95.28,95.28,-.04,-.04,.05,.05,.53,.68,-1.3312,.0565,
.0254,.0477,75333.8406,3342.6322
Järjestyksessä alleviivatut tulosmuuttujat ovat: Kuvien
lkm, latvan X, latvan Y, Latvan Z, Rlimit, XYthin, EllipseWidth, EllipseShift,
EllipseHeight, plotradius, puita, kandidaatteja, osumia, omissioita, komissioita,
löydettyjen osuus, accuracy-index, löydettyjen Z-harha, X-harha,
Yharha, RMSE(XY), RMSE(Z), kulmakerroin, löydetty tilavuus löytämättä
jäänyt tilavuus. The underlined variables
are: number of images, X of model tree, Y of model tree, Z of model tree,
Rlimit (lowest correlation), XYthin (m, merge parameter in clustering of
volumetric correlation), EllipseWidth (m), EllipseShift (m), EllipseHeight
(m), plot radius, Number of trees inside the plot, number of produced tree
top candidates, number of omissions, number of commissions, percentage of
found trees, AI-%, bias in Z, bias in X, bias in Y, RMSE of XY-errors, RMSE
of Z-errors, slope of averaging (m/m height), volume of found stems
(litres), volume of missed stems (litres).
Kuva: Yo. kuvan ratkaisua vaihdeltiin kokeilemalla Rlimit-parametrin
arvoja välillä 1.2 - 1.72. Tulokset haettiin C:\DATA\MA4RES.TXT
tiedoston lopusta ja niistä piirrettiin kuvaajat tarkkuus-indeksille
(AI), löydettyjen puiden osuudelle, komissiovirheiden osuudelle sekä
omissiovirheiden osuudelle. I tested the sensitivity
to the parameter Rlimit, which gives the lowest allowed correlation coefficient
(scaled 0..2).
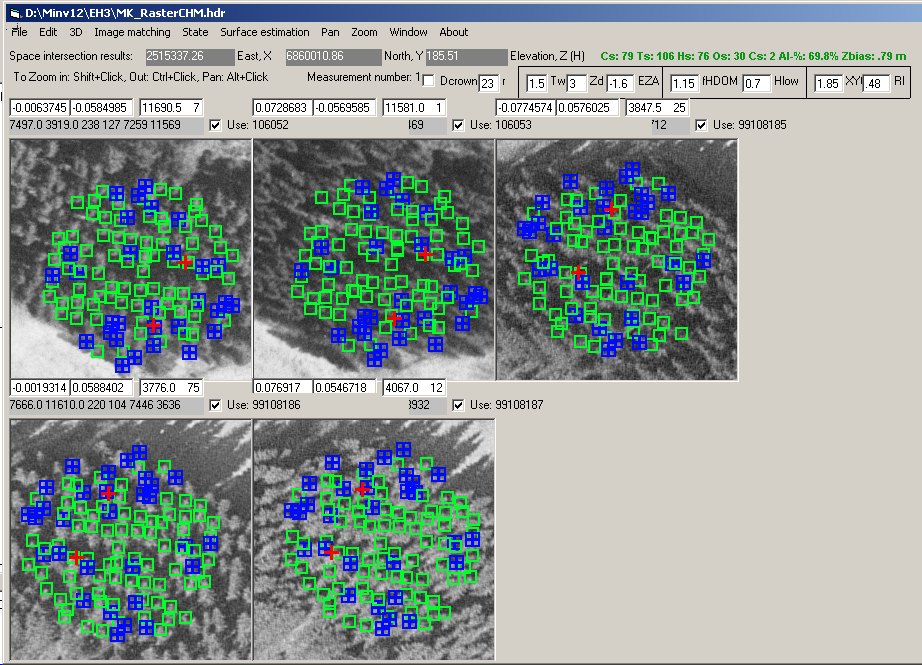
Kokeilin latvojen paikannusta topografisilla kevätkuvilla toukokuulta
1999 ja 2000, mittakaavassa 1:16000, kamera 21/23 cm. Koska kyseessä
havumetsä, ei kuvausaika, lehdettömänä aikana ole ongelma.
AI-% sai arvon 70% ja kandidaatit olivat keskimäärin 79 cm 2002
maastomittausten alapuolella. Next I tried 3D tree
top positioning using topographic leaff-off images from 1999 and 2000, when
the area was photographed for updating basic maps (map databases by NLS).
Muistokuusikko is just at the border of two map sheets, thereby we have images
from both 1999 and 2000. Scale of the images in 1:16000 and they been taken
with normal-angle (21/23 cm) cameras. AI-% of 70 was obtained and the bias
in Z was 79 cm, which is close to the height increment between May 1999/May
2000 and August 2002 (reference).
Kokeilin mittakaavan 1:6000, 1:8000, :12000, 1:14000, 1:16000 ja 1:20000
kuvilla korrelaation laskentaa (EllipseWidth 1.5 m); vaste-ajat alkavat käydä
liian pitkiksi, kun mittakaava (maastoresoluutio) on suurempi kuin 1:10000.
KUVAMITT ilmoittaa laskennan yhteydessä kunkin korrelaatiokuvan laskemiseen
kuluneen ajan. Kuvan koko on aina 3.5 kertaa ilmakuvakoealan säde. I tried how long it takes to compute template matching with
normalized cross-correlation with images of varying scale (80 x 80 m, EllipseWidth
1.5 m). The computational complexity grows to the fourth power when image
scale is doubled, and when the pixel size is larger than 20 cm, the run-times
start to become intolerable.
Herkkyys parametrille XYthin
Kokeilin neljää 1:8000 VÄI-kuvaa käytettäessä
ratkaisun herkkyyttä parametrille XYthin. Kuvassa sen vaikutus komissio-
ja omissiovirheisiin. Vaste on melko "laiska", s.o. ratkaisu ei ole herkkä
parametrn arvolle. Using a quadruplet of 1:8000 images
I examined the sensitivity to the clustering parameter XYthin, which controls
the density of the found tree tops. The curves for AI-%, commission error-%
and omission-error-% are rather flat.

Kokeilin neljää 1:8000 VÄI-kuvaa käytettäessä
ratkaisun herkkyyttä parametrille XYthin. Kuvassa sen vaikutus paikannusvirheisiin.
Vaste on melko "laiska", s.o. ratkaisu ei ole herkkä parametrin arvolle.
Using a quadruplet of 1:8000 images I examined the sensitivity
to the clustering parameter XYthin, which controls the density of the found
tree tops. .
Herkkyys parametrille Hlow, eli sille suhteelliselle
korkeudelle, jonne hakuavaruuden alaraja asetetaan. With the same image set I tested the sensitivity of the
results to parameter Hlow, which gives the elevation (relative to dominant
height) above which trees are searched for in the canopy.

Muistokuusikossa sopiva alarajan arvo (kun fHDOM = 1.15) on välillä
0.6..0.8. Jos arvo nousee 0.85 ja yli "litistyy" hakuavaruus ja pienten
puiden pituus yliarvioituu (BiasZ), kunnes niitäkään ei enää
saada kiinni arvoilla 0.95-1.00 (AI-%). When the upper
limit for the search space (fHDOM) was set at value 1.15, the optimal value
for Hlow was between 0.6 and 0.8. If the values were set above 0.85, the
search space became "thin" and the heights of small trees were overestimated
(Zbias). When Hlow was set to the height of the dominant trees (0.95), the
small trees were missed (see omission curve).
Herkkyys parametrille fHDOM, eli sille, kuinka
ylös suhteessa lidarDSM:n antamaan valtapituuteen nähden hakuavaruus
asetetaan. Hlow = 0.75, 4 x 1:8000 kuvaa. Sensitivity
to parameter fHDOM. fHDOM scales (lifts) the lidar CHM, or corrects its bias
with respect to local dominant height of trees.


RMSE(Z) mielessä optimi on alueella 1.1...1.25; AI-% pysyy > 80
% välillä 1.05...1.35. The optimal values
are from 1.1 to 1.25 considering all used performance measures.
Kokeilin kuvamäärän vaikutusta
neljällä 1:8000 mittakaavan kuvalla (21/23 cm kamera); 4 kuvasta
saattoi valita kuvapareja kuusi erilaista {AB AC AD BC BD
CD} ja kuvakolmikoita neljä {BCD ACD ABD ABC}. I tested the effect of the number of images with the quadruplet
of images in scale 1:8000. A quadruplet alows for six different pairs and
four triplets.

Tulokset ovat melko herkkiä kuvakombinaatiolle. Muihin parametreihin
ei koskettu kuvia vaihdettaessa (klikkasin "Use ######" rukseja vaihtaakseni
kombinaatiota, ja laskin taaksepäinleikkauksen CTRL-N sekä
klusteroinnin CTRL-W aina kullekin kombinaatiolle) . Kolmella kuvalla näyttäisi
saavan hieman parempaa tulosta (AI-% ei heittele) The
results seem to be quite sensitive to the selection of images in the back-projection
phase where 3D correlation is aggregated for points in the object space.
With triplets the results seem more stable.
Kokeilin paikannusta 1:30000 kuvaparilla;
parhaimmillaankin AI-% oli 45%; (5 komissiovirhettä, 53 löytynyttä,
53 hutia) vaikuttaisi siltä, että mittakaava ei sovi tehtävään
(pikselikoko 42 cm).
With an images pair in the scale of 1:30000 the best-case
AI-% was 45, with 53 trees found and 5 false trees. It seems that this scale
is not suited for the task.
Mittakaavan 1:14000 kuvilla, käytettäessä 8 kuvaa,
pääsin kerran 100 % AI-% arvoon, yli 90 % ratkaisuja oli helppo
löytää.
With eight images (80/60% overlaps) in scale 1:14000,
I once managed to find all trees without a single false tree. Cases, in which
AI-% was above 90 were easy to find.
Mittakaavan 1:8000 kuvilla en päässyt juurikaan yli 90
% (AI-%) neljällä kuvalla.
With four images (60/60% overlaps) in scale 1:8000,
the bset-case AI-% were from 80-85..
Mittakaavan 1:6000 kuvilla laskenta vei liikaa aikaa...
With scale 1:6000 it took too long to compute template
matching, I gave up.
Mittakaavoja yhdistelemällä (12000, 14000, 16000) pääsin
monasti 93-96 % AI-% tasolle.
By combinig images of different scales (1:12000, 1:14000,
1:16000) I often reached an AI-% of 93-96..