Erikoisharjoitus II Luennoitsijan esimerkki
"omasta virityksestä"
Mallilatva-algoritmi 4.4-5.4.2006 © Ilkka Korpela
Special assignment II, Teacher's example on "your own
algorithm for finding single trees from sparse lidar data"; "Model-tree -algorithm"

Yo. pisteen kohdalta löytyy lidar dataa kolmen kaistan alta s.e.
pistetiheys on noin 2 pistettä neliölle. Around this XYZ point the lidar data has a density of ca.
2 p per m2, because it is under three strips.
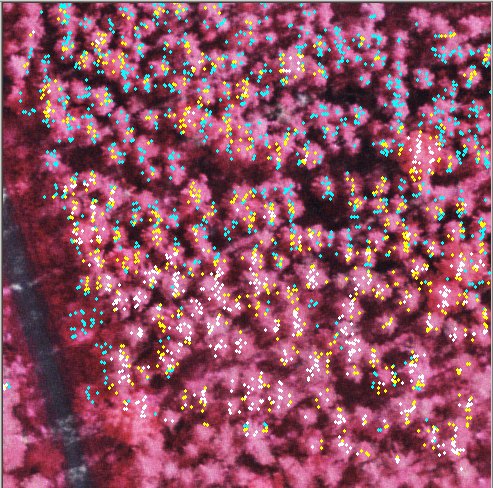
Pisteitä luokiteltuna, korkeus maanpinnasta luokittemena 8..12 m
(siniset), 12..15 m (kelt) ja yli 15 m (valk). Normalized
lidar points superimposed in a near-nadir view: blue points 8-12 m, yellow
points 12-15 m and white points 15 m > ground.
Plot_als_bin_file() aliohjelmassa kirjoitin noin 60 x 60 m alueelta pisteet
ASCII-tiedostoon Using KUVAMITT's plot_als_bin_file() routine I wrote the
normalized points into an ASCII-file for an area of 60 x 60 m.
Z_maaf = getheight(CDbl(LP.Xf), CDbl(LP.Yf))
Z_maas = getheight(CDbl(LP.Xs), CDbl(LP.Ys))
Print #6, LP.Xl, LP.Yl, LP.Zl, LP.Xf, LP.Yf, LP.Zf - Z_maaf, LP.Intf,
LP.Rangef, LP.Xs, LP.Ys, LP.Zs - Z_maas, LP.Ints, LP.Rangel
Tein VB-ohjelman, joka Then I wrote the algorithm
into a Visual Basic program. Steps are
1) Lukee lidar-pisteet (fp-datalla tehdään analyysit)
Read the ASCII data (first pulses are used only)
2) Sorttaa ne korkeuden (korkeus maasta) mukaan Sort the points in the order of ground normalized height
3) Muodostaa referenssilatvuksen y = a * x^b + c, jossa y on latvuksen
säde, kun ollaan x-metriä latvapisteen alapuolella Make a paraboloidic "crown model" for the radius (y) of
the symmetric crown as a function of the distance (x) below top.
4) Tekee korkeimmasta lidarpisteestä ensimmäisen puun Take the highest point and make it into a treetop
5) Testaa lidarpisteitä korkuesjärjestyksessä (h > Hlimit,
esim. 10 m); jos testattava piste jää olemassaolevan "puun" latvuksen
sisään, siitä ei tehdä uutta puuta, muuten tehdään
uusi puu. Korkein osuma puussa = latvapisteen XYZ. In the order of normalized height, test if points fall into
existing crown envelopes, if not, they make new trees. The highest lidar
point gives the tree top XYZ-coordinates. Stop when normalized height is
at a threshold, e.g. 10 m in a mature stand.
6) Lopuksi tulostaa puut ASCII-tiedostoon, jonka voi lukea KUVAMITT-ohjelmaan
ja projisoida latvapisteet kuvalle: Make an ASCII
file of the found tree tops so that they can be visually checked with aerial
photos:
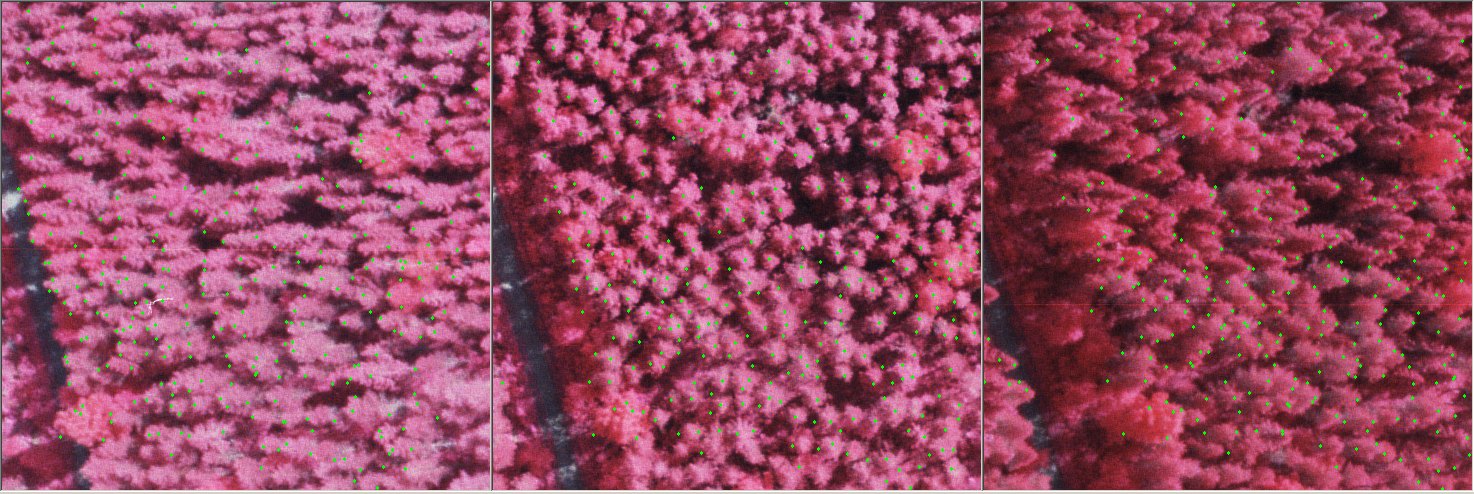
Tulokset voi printata ilmakuvalle: tässä kuvakolmikko 04403
lennolta, korkeusrajoitteena oli 10 m eli sitä lyhyempiä puita
ei haettu. Treetops superimposed in an image triplet.
Height limit was set at 10 m, i.e. trees shorter than that were not searched
for.
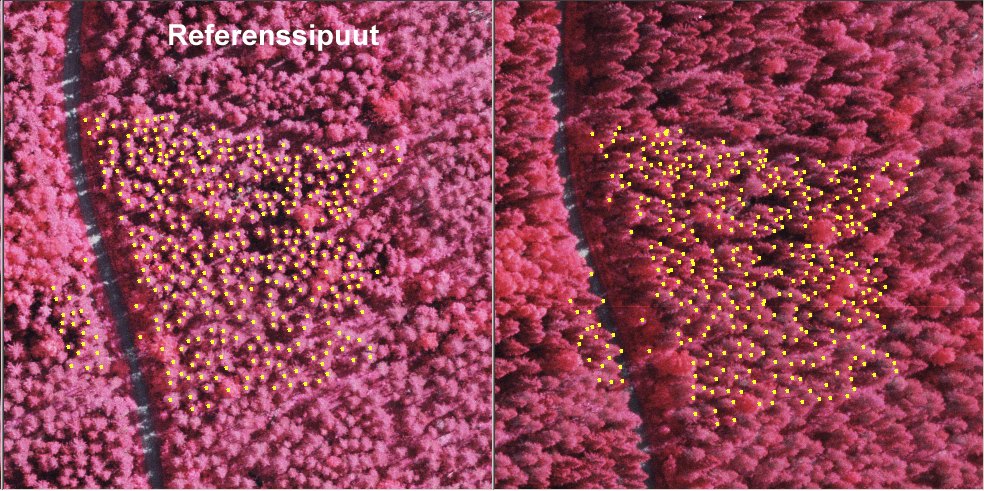
Mittasin 382 kpl fotogrammetrisia latvoja KUVAMITT-ohjelmalla
referenssipuiksi. Alueen koko on noin 80 x 60 m eli puuston tiheys on
noin 800 n/ha, mikä on varsin suuri, koska puuston valtapituus on noin
20-21 m. Visuaalisesti arvioituna puusto on pääasiassa mäntyä
ja kuusta, joukossa muutama kookas susipuu-koivu (pisin 22.2 m). 382 puun
mittaamiseen kului aikaa 115 minuuttia => kokenut mittaaja paikantaa
latvoja manuaalisesti miltei 200 tunnissa. Käytin hyväkseni lidar-dataa;
projisoin yli 10-metriä korkealta olevat pisteet kuville, mikä
auttoi löytämään kuvilla huonosti erottuvia hahmoja (vrt).In the area I
measured photogrammetric reference (manual image-matching from 2-6 images)
data of 382 tree tops in an area of approximately 80 x 60 m. This gives an
avarage density of 800 n/ha, which is rather high for stand height of 16-20
m. Visual interpretation suggests that the area is a mized stand of pine
and spruce with some large dominant birches. The manual 3D positioning took
115 miniutes giving an average speed of 200 trees per hour, which is achievable
for an experienced operator. In the work I made use of the lidar data, having
the >10 m points superimposed in the images helped in findind partially
shaded and occluded (in some views unseen trees) tree tops.
Esimerkki kun "latvus" oli "kartiokas". Bubble'n koko ilmaisee korkeutta
maanpinnasta (puun pituutta). Example of trees
found by the algorithm (o) and the reference data (o). The size of the circle denotes height above
ground. Crown form here was "conical".
Esimerkki tuloksista, kun mallilatvus oli latvastaan heti 4-metriseksi
sylinteriksi pyöristynyt sylinteri. Tulokset ovat parempia alueen itäreunassa,
jossa puut ovat pidempiä / suurempia (latvuksen koon voisi antaa määräytyä
pituuden funktiona!). Huomaa, latvuksessa on aina tasainen (katkaistu),
vakion c-säteinen alue, koska lidar harvoin osuu latvuksen korkeimpaan
kohtaan, jolloin olisi kohtuutonta olettaa malli latvukselle terävä
huippu. Example of trees found by the
algorithm (o) and the reference data (o).
The size of the circle denotes height above ground. Crown form here was "a
round cylinder, 4 meter in width". The results are better in that part of
the area where trees are taller, because here the size of the crown was fixed!,
The model crown y = a*x^b+c has a flat top (c ~0.5 m) because the lidar pulses
seldom hit the tree apexes.
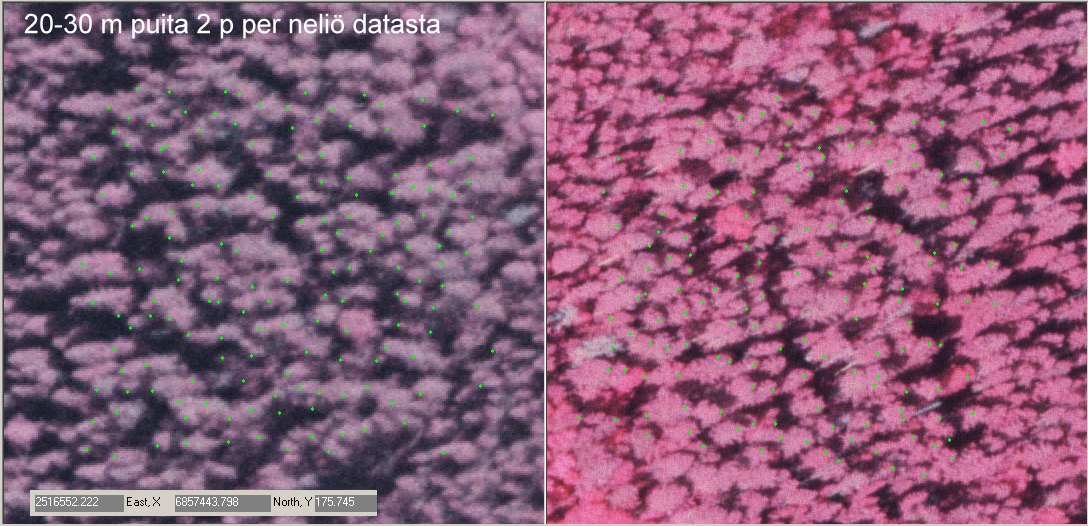
Esimerkki tuloksista Kuivajärven LH-metsässä (puut 20-32-metrisiä
mänty ja kuusia), kun latvuksen muoto skaalautuu puun pituuden mukaan
(kts. osakuva). Kahden lidar-linjan alta, tiheydellä 1.4 pistettä
neliölle, löytyy noin 60% puista s.e. komissiovirheitä tulee
varsin vähän, mikä on menetelmään "sisäänrakennettu
ominaisuus". Example of results in Kuivajärvi
old growth (tree heights 20-33 m), two strips, 1.4 points per m2. Here
the size of the crown is a function of tree height. Apprx. 60% of the
trees are found with a low commission error-rate.
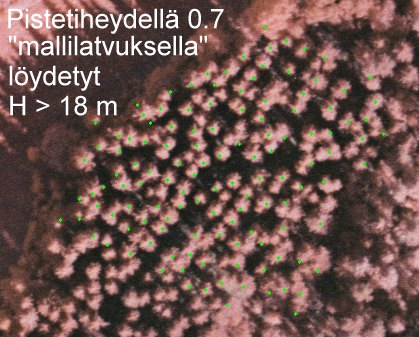
Pituuden mukaan skaalautuvalla "mallilatvuksella" harvasta (2 p per
m2) löydetyt latvapisteet 18-metrisessä MÄ/KU metsikössä.
Tree tops found by the algorithm with scalable crown
size in a 18-m high pine-spruce stand (2 p per m2 point density)
Esimerkki "mallilatva-algoritmin" löydöksistä, kun ollaan
yhden stripin alla ja pisteitä on vain 0.7 neliölle, Muistokuusikko
, puiden pituus 20-30 m. Tree tops found by the algorithm
with scalable crown size in a 26-m high spruce stand (0.7 p per m2 point
density)
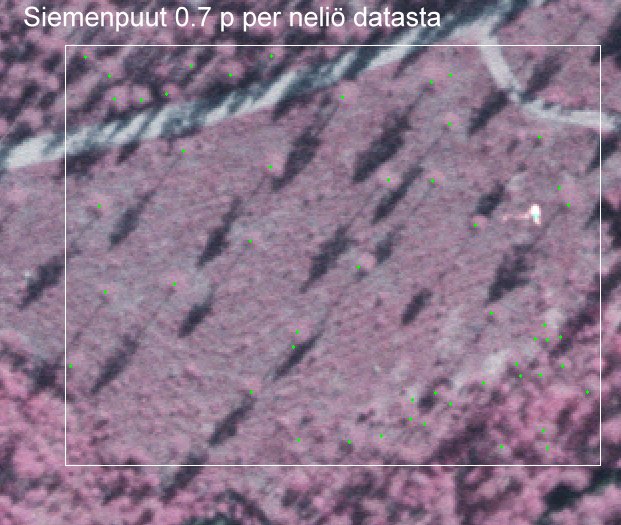
Esimerkki "mallilatva-algoritmin" löydöksistä, kun ollaan
yhden stripin alla ja pisteitä on vain 0.7 neliölle, Lapinkangas,
siemenpuumännikkö, puiden pituus 18-25 m. Huom! kuinka huono kontrasti
latvoilla on kuvalla, ilmakuvapohjaisella menetelmällä tuskin saisi
latvoja esiin (varjot kyllä). Tree tops found
by the algorithm in a seed tree stand where image-based methods are likely
to fail because of low texture. (0.7 p per
m2 point density)
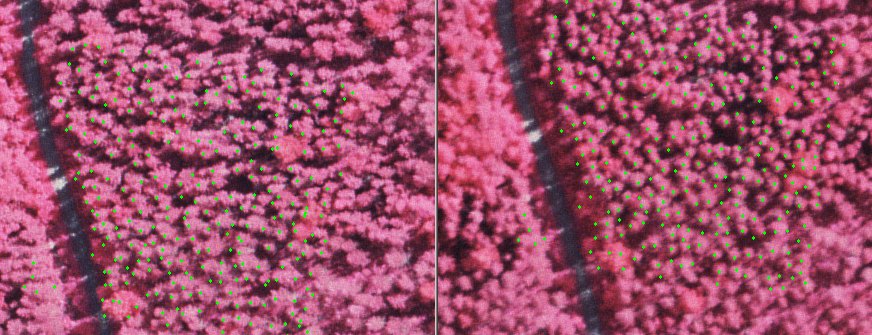
Pituuden mukaan skaalautuvalla "mallilatvuksella" harvasta (2 p per
m2, kolme linjaa) löydetyt latvapisteet 23-30-metrisessä MÄ/KU
metsikössä. Tree tops found by the algorithm
in a stand with 23-30-m high trees. (2 p
per m2 point density)
Algoritmia voi virittää ottamaan huomioon lidar-pulssin suunnan,
jokaiselle pisteelle tiedetään suunta (i,j,k), josta se tulee. Voidaan
esim. otaksua, että keskimäärin osutaan 1 metri latvan alle,
jolloin paikkaa korjataan XY-suuntaan matka, jotka saadaan lidarin suuntavektorista
(i,j,k), kun tullaan metri alaspäin. Tree tops
are corrected for the XYZ-top position to take into account the oblique "viewing"
by the lidar, ±20o in our ALTM2033 data. The lidar pulses
are known for the direction vector, and if we assume that on average, the
bias is 1 m downwards (apex is missed), the XY-path crossed by the pulse
(last 1 m) is used for correcting the treetop position.
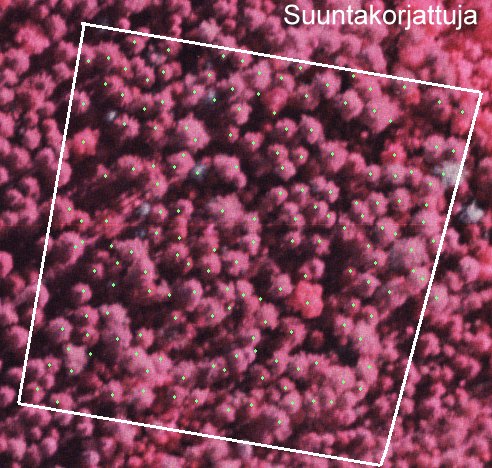
Suuntakorjattuja yli 20 metristen puiden latvapisteitä. Example of corrected positions in a stand with 23-30-m
high trees. (2 p per m2 point density)
OHJELMAKOODI (Ilman skaalautuvaa latvusta, suuntakorjauksia)
(Source code, fixed-size crown, no correction
for the non-orthogonal pulses)
Form1-aliohjelma
Private Sub Read_Lidar_Data_Click()
Rem Be prepared for 30000 pulses
ReDim LP(1 To 30000) As LidarPulse
Dim PlotCenter As point3D
Rem Center for 40 x 40 m plot
PlotCenter.x = 2515721.92
PlotCenter.y = 6861248.68
PlotCenter.z = 190
Open "c:\data\3strips_lidar_points.txt" For Input As 1
i = 1
Do Until EOF(1)
Input #1, LP(i).Xl, LP(i).Yl, LP(i).Zl, LP(i).Xf, LP(i).Yf, LP(i).Hf,
LP(i).Intf, LP(i).Rangef, LP(i).Xs, LP(i).Ys, LP(i).Hs, LP(i).Ints, LP(i).Rangel
i = i + 1
Loop
Rem Make LP contain exactly as many pulses as there are
ReDim Preserve LP(1 To i) As LidarPulse
ReDim Hftau(1 To i) As Single
ReDim Hfind(1 To i) As Long
Dim mx As Long
For mx = 1 To i
Hftau(mx) = LP(mx).Hf
Next mx
Rem Sort data in order 1st = lowest, last = highest
Call indexx(CLng(UBound(Hftau)), Hftau, Hfind)
ReDim Trees(1 To 5000) As point3D
Dim Ntrees As Long
Rem Make highest point as seed, it surely is a treetop
Trees(1).x = LP(Hfind(i)).Xf
Trees(1).y = LP(Hfind(i)).Yf
Trees(1).z = LP(Hfind(i)).Hf
LP(Hfind(i)).Treehit = True
Ntrees = 1
Dim cf As Double, pw As Double, cont As Double, Hlimit As Double
Rem coefficients for the crown shape formula
cf = 0.4
pw = 0.75
cont = 0.6
Hlimit = 10
Rem let's start processing of data, take the highest points first
For i = UBound(Hftau) To 1 Step -1
If LP(Hfind(i)).Treehit = False And LP(Hfind(i)).Hf
> Hlimit Then
Rem It is an unused point
For j = 1 To Ntrees
xydist = Sqr((LP(Hfind(i)).Xf
- Trees(j).x) ^ 2 + (LP(Hfind(i)).Yf - Trees(j).y) ^ 2)
zdist = (Trees(j).z - LP(Hfind(i)).Hf)
Rem Zdist gives the crown width,
if within, then merge
If (cf * zdist ^ pw + cont)
< xydist Then
Rem It is possibly a
new tree unless it belongs to an existing
Exists = False
For k = 1 To Ntrees
If j <> k
And Sqr((Trees(k).x - LP(Hfind(i)).Xf) ^ 2 + (Trees(k).y - LP(Hfind(i)).Yf)
^ 2) < (cf * (Trees(j).z - Trees(k).z) ^ pw + cont) Then
Exists =
True
End If
Next k
If Exists = False Then
Ntrees = Ntrees
+ 1
Trees(Ntrees).x
= LP(Hfind(i)).Xf
Trees(Ntrees).y
= LP(Hfind(i)).Yf
Trees(Ntrees).z
= LP(Hfind(i)).Hf
LP(Hfind(i)).Treehit
= True
GoTo NextPoint
End If
End If
Rem It belongs to an
existing
LP(Hfind(i)).Treehit
= True
GoTo NextPoint
NextTree:
Next j
End If
NextPoint: Next i
MsgBox ("Done we have " & Ntrees & " trees " )
Close (1)
Rem Print a file for KUVAMITT (CTRL-Q) plotting, remember that heights
are above ground, add DTM-elevation in order to get treetops correctly in
N60
Open "C:\data\Latvat.txt" For Output As 2
Print #2, 0
Print #2, 0
Print #2, 0
Print #2, 0
Print #2, 0
Print #2, 0
Print #2, 0
For mx = 1 To Ntrees
Print #2, Trees(mx).x & "," & Trees(mx).y & "," &
Trees(mx).z & "," & 200 & "," & 0 & "," & 1 &
"," & 2 & "," & 11
Next mx
Close (2)
End Sub
MODULE1.BAS :n sisältö, määrittelyt ja HEAPSORT
lajittelu
Type point3D
x As Double
y As Double
z As Double
End Type
Type LidarPulse
Xl As Double
Yl As Double
Zl As Double
Xf As Double
Yf As Double
Hf As Double
Intf As Byte
Rangef As Double
Xs As Double
Ys As Double
Hs As Double
Ints As Byte
Rangel As Double
Treehit As Boolean
PlotHit As Boolean
Tree As point3D
End Type
Public LP() As LidarPulse
Public Sub indexx(ByVal N As Long, ra() As Single, indx() As Long)
Rem Heapsort from Numerical recipes
Rem indx(1 to N) is an index table, returned
Rem ra(1 to N) is the data to be sorted, left as is.
Dim i As Long, j As Long, l As Long, ir As Long, indxt As Long
Dim q As Single
Dim apu As Integer
On Error GoTo virhe_sort
For j = 1 To N
indx(j) = j
Next j
l = N / 2 + 1
ir = N
10:
If (l > 1) Then
l = l - 1
indxt = indx(l)
q = ra(indxt)
Else
indxt = indx(ir)
q = ra(indxt)
indx(ir) = indx(1)
ir = ir - 1
If (ir = 1) Then
indx(1) = indxt
Exit Sub
End If
End If
i = l
j = l + l
20: If j <= ir Then
If j < ir Then
If (ra(indx(j)) < ra(indx(j + 1))) Then
j = j + 1
End If
If (q < ra(indx(j))) Then
indx(i) = indx(j)
i = j
j = j + j
Else
j = ir + 1
End If
GoTo 20
End If
indx(i) = indxt
GoTo 10
virhe_sort:
MsgBox ("Error in Heapsort, l is " & l)
End Sub